Greenhouse Gas Emissions
| Category |
Unit |
2026 |
2027 |
2028 |
2029 |
2030 |
| Projected Emissions | tCO2eq | 6824.85 | 6830.89 | 7816.23 | 8692.76 | 9158.23 |
| Target Emissions | tCO2eq | 6441.01 | 6063.22 | 6664.72 | 7157.42 | 7239.05 |
| Cumulative Reduction Target | tCO2eq | -383.84 | -767.68 | -1151.52 | -1535.36 | -1919.20 |
| Cumulative Reduction Rate | % | 2 | 4 | 6 | 8 | 10 |
| Category |
Unit |
2023 |
2024 |
2025 |
| Total GHG Emissions (Scope 1+2+3) | tCO2eq | 8,007.55 | 7,708.76 | 6,733.01 |
| Direct Emissions (Scope 1) | tCO2eq | 56.58 | 62.12 | 60.24 |
| Indirect Emissions (Scope 2) | tCO2eq | 7,950.98 | 7,646.64 | 6,672.78 |
| Other Indirect Emissions (Scope 3) | tCO2eq | - | - | - |
| GHG Emission Intensity | tCO2eq / KRW 1 Billion Revenue | 80.27 | 73.07 | 61.76 |
Energy
| Category |
Unit |
2023 |
2024 |
2025 |
| Total Energy Consumption | GJ | 63,140.63 | 60,834.88 | 58,440.21 |
| Direct Energy Consumption | GJ | 831.75 | 910.58 | 865.94 |
| Gasoline | GJ | 198.32 | 213.61 | 279.31 |
| Diesel | GJ | 103.53 | 133.64 | 168.63 |
| LPG | GJ | 529.90 | 563.33 | 417.99 |
| Others | GJ | 0 | 0 | 0.00004 |
| Indirect Energy Consumption | GJ | 62,304.87 | 59,920.07 | 57,571.28 |
| Electricity | GJ | 62,304.87 | 59,920.07 | 57,571.28 |
| Energy Intensity | GJ / KRW 1 Billion Revenue | 632.94 | 576.61 | 536.09 |
Waste
| Category |
Unit |
2023 |
2024 |
2025 |
| Total Waste Generated | ton | 1714.15 | 1406.84 | 1364.06 |
| Incineration | ton | 58.5 | 56.2 | 63.2 |
| Landfill | ton | 139.6 | 67.2 | 61.1 |
| Recycling | ton | 1,516.04 | 1,283.50 | 1,239.73 |
| Recycling Rate | % | 88.4 | 91.2 | 90.9 |
| Waste Generation Intensity | ton / KRW 1 Billion Revenue | 17.2 | 13.3 | 12.5 |
Air Pollutants
| Category |
Unit |
2023 |
2024 |
2025 |
| Total Air Pollutant Emissions | ton | 3.66 | 2.46 | 4.33 |
| Nitrogen Oxides (NOx) | ton | 0 | 0 | 0 |
| Sulfur Oxides (SOx) | ton | 0.07 | 0.16 | 0.14 |
| Particulate Matter (PM10) | ton | 0.86 | 0.35 | 1.01 |
| Other Air Pollutants | ton | 2.73 | 1.95 | 3.17 |
| Air Pollutant Emission Intensity | ton / KRW 1 Billion Revenue | 0.04 | 0.02 | 0.04 |
Water Usage
| Category |
Unit |
2023 |
2024 |
2025 |
| Total Water Withdrawal | ton | 13,615 | 15,796 | 18,206 |
| Municipal Water Supply | ton | 13,615 | 15,796 | 18,206 |
| Total Water Consumption | ton | 13,615 | 15,796 | 18,206 |
| Recycled Water Volume | ton | 81.0 | 114.3 | 107.2 |
| Water Recycling Rate | % | 0.6 | 0.7 | 0.6 |
| Water Withdrawal Intensity | ton / KRW 1 Billion Revenue | 136.48 | 149.72 | 167.01 |
Wastewater
| Category |
Unit |
2023 |
2024 |
2025 |
| Wastewater Discharge Volume | ton | 28 | 27 | 34 |
| Wastewater Discharge Intensity | ton / KRW 1 Billion Revenue | 0.28 | 0.26 | 0.31 |
Workforce Profile
| Category |
2023 |
2024 |
2025 |
| Employment Type | Permanent Employee | 178 | 183 | 178 |
| Temporary Employee | 0 | 0 | 0 |
| Total Employees | 178 | 159 | 159 |
| Social Insurance Coverage Rate (%) | 94.4 | 91.8 | 93.1 |
| Age Group | Under 18 | 0 | 0 | 0 |
| 18–29 | 13 | 19 | 12 |
| 30–49 | 116 | 115 | 117 |
| 50 and Above | 49 | 49 | 49 |
| Gender | Male | 160 | 166 | 162 |
| Female | 18 | 17 | 16 |
| Disability Status | Non-disabled | 177 | 182 | 177 |
| Disabled | 1 | 1 | 1 |
| Nationality | Domestic | 163 | 166 | 161 |
| Foreign | 15 | 17 | 17 |
Recruitment
| Category |
2023 |
2024 |
2025 |
| Total New Hires | 21 | 22 | 11 |
| Employment Type | Permanent Employee | 21 | 22 | 9 |
| Temporary Employee | 0 | 0 | 2 |
| Gender | Male | 18 | 22 | 8 |
| Female | 3 | 0 | 3 |
Employee Turnover
| Category |
2023 |
2024 |
2025 |
| Total Turnover | 21 | 20 | 15 |
| Turnover Type | Voluntary Turnover | 21 | 20 | 15 |
| Involuntary Turnover | 0 | 0 | 0 |
Average Years of Service
| Category |
2023 |
2024 |
2025 |
| Average Years of Service | 8.5 | 8.5 | 9.2 |
| Gender | Male | 8.5 | 8.5 | 9.2 |
| Female | 8.3 | 8.4 | 9.8 |
Training & Development
| Category |
2023 |
2024 |
2025 |
| Total Training Hours | 2,272 | 1,406 | 3,139 |
| Total Training Cost | 1,428,000 | 1,660,500 | 2,484,000 |
| Training Hours per Employee | 36.65 | 26.04 | 44.21 |
| Training Cost per Employee | 23,032.26 | 30,750.00 | 34,985.92 |
Grievance Handling
| Category |
2023 |
2024 |
2025 |
| Reported Cases | 0 | 0 | 0 |
| Resolved Cases | 0 | 0 | 0 |
| Resolution Rate | 0 | 0 | 0 |
Human Rights
| Category |
2023 |
2024 |
2025 |
| Reported Cases | 0 | 0 | 0 |
| Resolved Cases | 0 | 0 | 0 |
| Regulatory Violations | 0 | 0 | 0 |
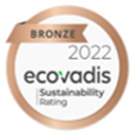
EcoVadis Assessment Results
2022
55 Points
| Environment |
Labor & Human Rights |
Ethics |
Sustainable Procurement |
| 50 |
60 |
60 |
50 |
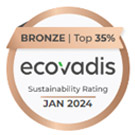
2024
63 Points
| Environment |
Labor & Human Rights |
Ethics |
Sustainable Procurement |
| 70 |
60 |
60 |
50 |
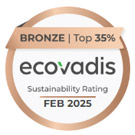
2025
61 Points
| Environment |
Labor & Human Rights |
Ethics |
Sustainable Procurement |
| 64 |
62 |
59 |
47 |
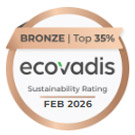
2026
67 Points
| Environment |
Labor & Human Rights |
Ethics |
Sustainable Procurement |
| 74 |
62 |
66 |
61 |
NQC Supplier Assurance
| Assessment Year |
Total Score |
Company Management |
Human Rights & Working Conditions |
Health & Safety |
Business Ethics |
Environment |
Responsible Supply Chain Management |
Responsible Raw Material Sourcing |
| 2025 |
79 |
82 |
64 |
84 |
100 |
82 |
52 |
100 |
| 2024 |
76 |
82 |
62 |
84 |
100 |
75 |
50 |
100 |